 IT2EDU Empowering Education Through Technology
Related Articles
What is a Data Analysis and what is the role of a Data Analyst?
A data analysis is a process which summarize the data sets or raw data. Data analysis is a process of examine, cleansing, transforming, and modeling data with the goal of discovering useful information, informing conclusions, and supporting decision-making system. Data analysis is depending on different parameters such as data resources, structure of data and volume of data. Data analysis has numerous features and methodologies, enveloping various strategies under an assortment of names, and is utilized in various business, science, and sociology workspace.In today’s business world data analysis plays a key role to make decisions wisely and effectively and helps to create numerous employment opportunities.
Get this post in PDF format from here
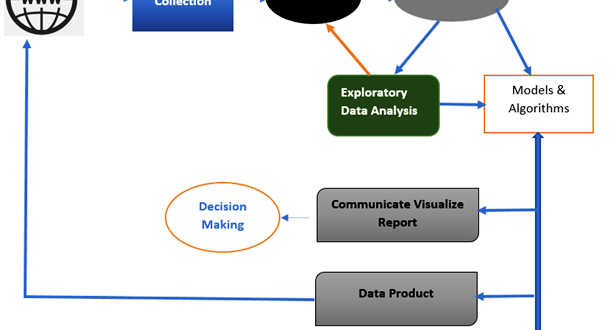
Data Analysis has different phases
- Data requirements
- Collection of Data
- Processing
- Cleaning
- Exploratory data Analysis
- Modelling and Algorithms
- Data presentation
- Communication

Data Analysis and Process
Data analysis is a process of taking raw data from the various resources and model it into useful for decision-making by end users. Often analysis refers examine the individual components from the whole.
By popular statistician John Tukey says about data analysis in 1961 as “Procedures for analyzing data, techniques for interpreting the results of such procedures, ways of planning the gathering of data to make its analysis easier, more precise or more accurate, and all the machinery and results of (mathematical) statistics which apply to analyzing data ”.
Data Requirements:
Data is a very important input to the analysis. The analysis depends on the input/data and depends on the user requirement. Data may be in the form of numerical or textual/categorical. The general type of entity upon which the data will be collected is referred to as an experimental unit (e.g., a person or population of people). Specific variables regarding a population (e.g., age and income) may be specified and obtained.
Data Collection:
Data collection may be in different forms and different resources. For, example surveys, quizzes, experimental data sensors in the environment, such as traffic cameras, satellites, recording devices, etc. Data collection is the process of collecting information related to target variables/inputs identified as data requirement. The requirements may be communicated by analysts to custodians of the data, such as information technology personnel within an organization. What the data collected is accurate and helpful in making valid decisions to the user. Data Collection provides both a baseline to measure and a target to improve. The collected may be organized and well-structured or may not. Hence, the collected data is required to be subjected to Data Processing and Data Cleaning.
Data Processing:
For analysis of data the is to be well structured and processed for analysis. This causes structuring the data for analysis tool compatibility. For Instance, the data might have to be placed into rows and columns in a table within a Spreadsheet or Statistical Application. A Data Model might have to be created.
Data Cleaning:
When prepared and composed, the information might be fragmented, contain duplicates, or contain blunders. The requirement for information cleaning will emerge from issues in the manner that information are entered and put away. Information cleaning is the way toward averting and rectifying these mistakes. Basic undertakings incorporate record coordinating, recognizing error of information, overall quality of existing data, deduplication, and column segmentation. Such information issues can likewise be distinguished through an assortment of explanatory methods. For instance, with money related data, the aggregates for specific factors might be contrasted against independently distributed numbers accepted with be reliable. Unusual sums above or underneath pre-decided edges may likewise be explored. There are a few kinds of information cleaning that rely upon the sort of information, for example, telephone numbers, email addresses, bosses and so on. Quantitative information techniques for anomaly recognition can be utilized to dispose of likely erroneously entered information. Printed information spell checkers can be utilized to diminish the measure of mistyped words, yet it is more enthusiastically to tell if the words themselves are correct.
Exploratory data Analysis:
Once the is processed, organized and cleaned that means the data is ready for Analysis. A wide range of tools and technologies are available in the market to understand and derive conclusions based on the requirements. Analysts may apply a variety of techniques referred to as exploratory data analysis to begin understanding the messages contained in the data. The process of exploration may result in additional data cleaning or additional requests for data, so these activities may be iterative in nature.Data Visualization may also be used to examine the data in graphical format, to obtain additional insight regarding the messages within the data. Average, median, Correlation, regression analysis like statistical data report may be generated to understand the processed data. These models that are descriptive of the data are helpful in simplifying analysis and communicate results.
Modelling and Algorithms:
The term modeling represents the way of representation of raw data into summarized or user quick understandable format data. So, in the process of analysis of data, analysts can do process, clean and modeling the data. Algorithms are mathematical formulas that can applied to identify the relationships between the data variables such as correlation. In general terms, models may be developed to evaluate a variable in the data based on other variable(s) in the data, with some residual error depending on model accuracy (i.e., Data = Model + Error).
Data Product:
A data product is software application to generate outputs. i.e Automate the analysis process of data when user dump the raw data into that software it will build the reports based on the user query like Power BI, Tableau, etc. It may be based on a model or algorithm.
Communication:
After completing the analysis of data, it needs to represent in a report format to the users. The users may have feedback, which results in additional analysis. As such, much of the analytical cycle is iterative.The data analysts can choose data visualization techniques, such as tables and charts, which help in communicating the message clearly and efficiently to the users. The analysis tools provide facility to highlight the required information with color codes and formatting in tables and charts.
Types of Data Analysis
Now a day’s different types of analysis techniques available in the market upon the requirement and purpose choose our own choice to analyse the data. These techniques encompass various categories like business, science and environment and statistical data.
These techniques are namely
- Data Mining
- Business Intelligence
- Predictive Analysis
- Statistical Analysis
- Textual data Analysis

Here we will go with details of the above techniques.
Data Mining:
Data Mining is one of traditional approach to analyse data, it mainly focuses on data modelling and knowledge discovery for predictive rather than purely descriptive purposes. Data mining is the process of discovering patterns in large data sets involving methods at the intersection of machine learning, statistics, and database systems.
In this approach, large data sets can be analysed. Data Mining is the examination of huge amounts of data to extricate beforehand obscure, intriguing examples of information, abnormal data and the conditions. Note that the objective is the extraction of examples and learning from a lot of information and not simply the extraction of data. Data mining analysis includes software engineering techniques at the crossing point of the reasoning, AI, machine learning, and database systems.
Business Intelligence:
Business intelligence techniques and tools are helpful in transforming of large amount of data, unstructured data to help and identify develop and create new innovative ideas for business opportunities. Main aim of business intelligence tools like Power BI, tableau are to allow easy interpretation of large data sets to identify the new business opportunities and making effective decisions at strategic level with market advantage and provide long-term benefits. Business intelligence is simplifying the process of decision making.
Predictive Analysis:
By using statistical models, predictive analysis will be done. In this analysis present and past data can be analysed for forecasting about the future. Most of the cases in the business world predictive analysis can be used to identify the future risks and making or effective decisions.
In excel latest versions Microsoft introduced forecast() function to predict the values.
Statistical Analysis:
An organization data or any data can be collected, analysed, interpreted and presented these are all comes under the statistical study of that organization. Statistics is a branch of mathematics working with data collection, organization, analysis, interpretation and presentation. In applying statistics to a scientific, industrial, or social problem, it is conventional to begin with a statistical population or a statistical model to be studied.
In data analysis there are two main categories
- Descriptive Statistics
In descriptive statistics large data can be summarised into numerical representations like median, average, standard deviation for continuous data, Frequency, rate of categorial data.Descriptive statistics provide simple summaries about the sample and about the observations that have been made. Such summaries may be either quantitative, i.e. summary statistics, or visual, i.e. simple-to-understand graphs. These summaries may either form the basis of the initial description of the data as part of a more extensive statistical analysis, or they may be enough in and of themselves for ainvestigation.Descriptive statistics are used to describe the basic features of the data in a study. They provide simple summaries about the sample and the measures. Together with simple graphics analysis, they form the basis of virtually every quantitative analysis of data.
- Inferential statistics
Statistical inference is the process of using data analysis to deduce properties of an underlying probability distribution. Inferential statistical analysis infers properties of a population, for example by testing hypotheses and deriving estimates. It is assumed that the observed data set is sampled from a larger population. Inferential statistics can be contrasted with descriptive statistics. Descriptive statistics is solely concerned with properties of the observed data, and it does not rest on the assumption that the data come from a larger population. It uses simple design in the sample data to draw inferences about the represented population or accounting for randomness.
For yes/no questions – Hypothesis testing
Estimation of numerical characteristics – Estimation
Modelling relationships within data – Regression analysis
Describing associations within the data sets – Correlation
Textual Data analysis:
Textual data analysis deals with text format data, which communicates researchers use to describe and interpret the characteristics of recorded message or visual message. The main goal of textual data analysis is to describe the content and its structure, functions of the messages in the text. In other words, text analysis is referred as text data mining. It identifies the qualitative text information from the text data. It finally evaluates and interpret the output.
Data Users and their Analytical Activities
Generally, an analyst can do multiple activities to achieve required output.Users may have data points of interest within a data set, as opposed to general messaging outlined above. Such low-level user analytic activities are presented in the following table. The taxonomy can also be organized by three poles of activities: retrieving values, finding data points, and arranging data points.
| Sno | Task | Description | Abstract | Examples |
| 1 | Retrieve a Value | Find attributes from the set of specific cases in the given raw data | What are the values of the attributes {X,Y,Z,…} in the case of {A,B,C…}? | What is the economy rate of the bowler in the t-20 world cup? What is the mileage per gallon of the Ford Mondeo? |
| 2 | Filter | By obeying certain concrete conditions on attribute values find satisifying conditional data | Which data cases satisfy conditions {A, B, C…}? | What comedies have won awards? |
| 3 | Compute derived value | Given a set of data cases, compute an aggregate numeric representation of those data cases | What is the value of aggregation function F over a given set S of data cases? | What is the average calorie content of Post cereals? What is the gross income of all stores combined? |
| 4 | Find Extreme | Find data cases possessing an extreme value of an attribute over its range within the data set. | What are the top/bottom N data cases with respect to attribute A? | What is the car with the highest MPG? |
| 5 | Sort | Given a set of data cases, rank them according to some ordinal metric | What is the sorted order of a set S of data cases according to their value of attribute A? | Order the cars by weight. Rank the grains by calories |
| 6 | Determine range | Given a set of data cases and an attribute of interest, find the span of values within the set. | What is the range of values of attribute A in a set S of data cases? | What is the range of film lengths? What is the range of car horsepowers? What actresses are in the data set? |
| 7 | Characterize Distribution | Given a set of data cases and a quantitative attribute of interest, characterize the distribution of that attribute’s values over the set. | What is the distribution of values of attribute A in a set S of data cases? | What is the distribution of carbohydrates in cereals? What is the age distribution of shoppers? |
| 8 | Find Anomalies | Identify any anomalies within a given set of data cases with respect to a given relationship or expectation, e.g. statistical outliers. | Which data cases in a set S of data cases have unexpected/exceptional values? | Are there exceptions to the relationship between horsepower and acceleration? Are there any outliers in protein? |
| 9 | Cluster | Given a set of data cases, find clusters of similar attribute values. | Which data cases in a set S of data cases are similar in value for attributes {X, Y, Z, …}? | Are there groups of cereals w/ similar fat/calories/sugar? Is there a cluster of typical film lengths? |
| 10 | Correlate | Given a set of data cases and two attributes, determine useful relationships between the values of those attributes | What is the correlation between attributes X and Y over a given set S of data cases? | Is there a correlation between carbohydrates and fat? Is there a correlation between country of origin and MPG? Do different genders have a preferred payment method? Is there a trend of increasing film length over the years? |
| 11 | Contextulaization | Given a set of data cases, find contextual relevancy of the data to the users. | Which data cases in a set S of data cases are relevant to the current users’ context? | Are there groups of restaurants that have foods based on my current caloric intake? |
Quantitative Messages
For data visualization purpose, Stephen Few described eight types of messages that users may attempt to understand or communicate from a set of data and the associated graphs used to help communicate the message. Customers specifying requirements and analysts performing the data analysis may consider these messages during the process.
- Time-Series: Capture a single variable over a period. For instance, sale of air conditioners over a decade. Line chart is suitable for graphical representation of this scenario.
- Ranking: Based on the category, attributes are ranked in ascending order or descending order. For example, sale person by gold items category. Bar chart representation is apt for this scenario.
- Part-to-whole: Categorical subdivisions are measured as a ratio to the whole (i.e., a percentage out of 100%). A pie chart or bar chart can show the comparison of ratios, such as the market share represented by competitors in a market.
- Deviation: Categorical subdivisions are compared against a reference, such as a comparison of actual vs. budget expenses for several departments of a business for a given time period. A bar chart can show comparison of the actual versus the reference amount.
- Frequency Distribution: Shows the number of observations of a variable for given interval, such as the number of years in which the stock market return is between intervals such as 0–10%, 11–20%, etc. A histogram, a type of bar chart, may be used for this analysis.
- Correlation: Comparison between observations represented by two variables (X,Y) to determine if they tend to move in the same or opposite directions. For example, plotting unemployment (X) and inflation (Y) for a sample of months. A scatter plot is typically used for this message.
- Nominal comparison: Comparing categorical subdivisions in no particular order, such as the sales volume by product code. A bar chart may be used for this comparison
- Geographic: Comparison of a variable across a map or layout, such as the unemployment rate by state or the number of persons on the various floors of a building. A cartogram is a typical graphic used.
The above content has been taken from Wiki.